Lecture 2
Urban Data
Maps + Census
2025-03-31
Welcome!
This week: Introduction to Urban Data - Census data as a tool for understanding urban systems

What is the census
A comprehensive survey measuring population characteristics
Aim: count all individuals in a country / region (and some of their characteristics)
Around the world:
In most countries, censuses occur every 10 years
Some countries rely on very old censuses (DRC - 1984, Iraq - 1987, Afghanistan - 1979)
Different variables are collected by different countries. For example, censuses of race and ethnic origin are banned in France
Censuses are expensive! The 2020 US Census cost $13.7 Billion

The US Census
A population census is required by the constitution every 10 years
The census determines electoral representation and re-districting, as well as billions of dollars in federal and state funding
The US Census (formerly called the “short form” census) collects basic information:
Number of people living in a household
Basic demographics: age, sex, race, hispanic origin, relationship to householder
Housing tenure (whether a family owns or rents their home)

American Community Survey
Annual survey measuring detailed population characteristics in 4 domains: Demographic, Economic, Housing, Social.
See the ACS Subjects Explorer
Detailed survey of a sample of US households (3.5 Million in 2015).
- The ACS has replaced the “long form” census.
ACS responses are: re-weighted to adjust for sampling bias, modeled to impute responses for small areas.
Sufficient data is required for accurate modeling of detailed population characteristics
- ACS estimates are released in rolling 5-year windows (i.e. 2020 release uses data from 2016 to 2020).

The Census is a form of “big data”
Although we now consider the Census to be “traditional data” - comprehensive data on population characteristics were a huge advance in quantitative social science.
For example, the First UK census was the basis for E. G. Ravenstein’s “Laws of Migration”
Census data was tabulated by hand and revealed regularities in migration behavior.
These regularities supported the Gravity and Intervening Opportunities models of human mobility (which we will use later in this course).

Combining census and behavioral data
Census data only represent some aspects of human behavior. Luckily, behavioral data often complement (rather than duplicate) information from the census.
Variables such as education, race, gender, and income, independently explain approximately 50–55% of the variation in economic outcomes (e.g., median household income or property values) [2]
Similarly, exposure between socio-economic status (SES) groups driven by demographic characteristics accounts for half of the variance in cross-class friendships [3]

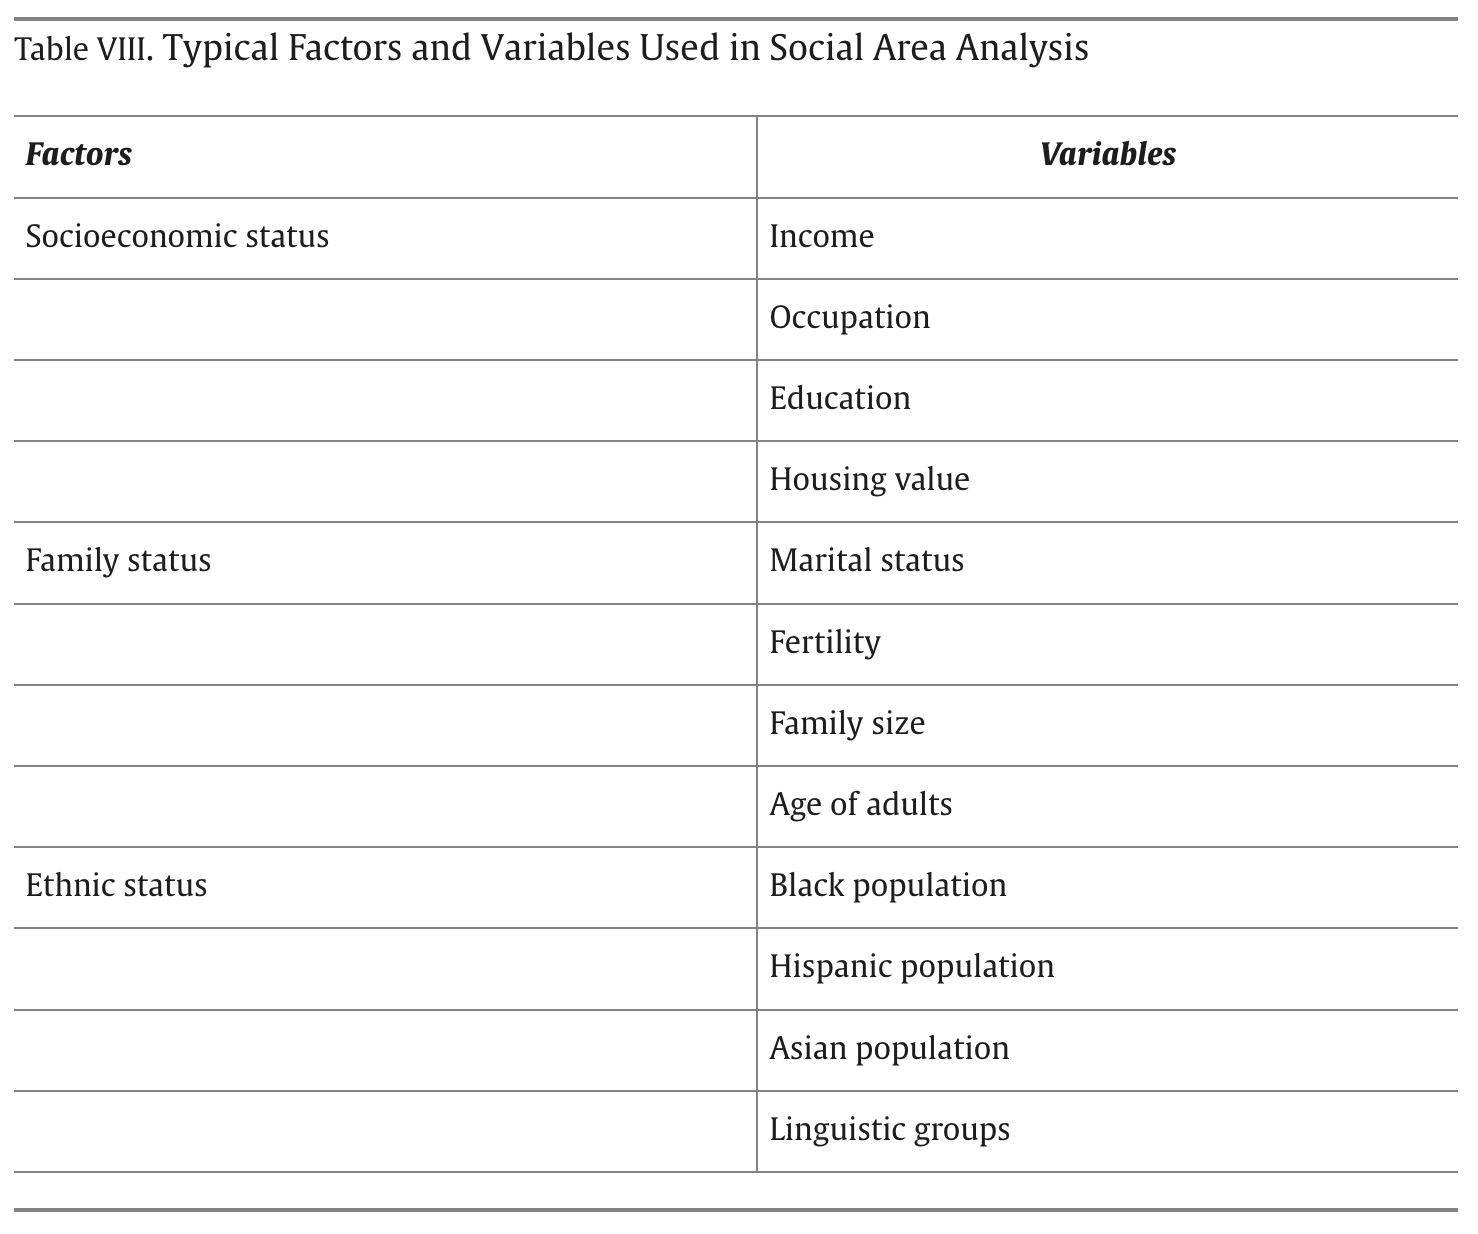
Today’s practical: Social Area Analysis
Consider the underlying social “factors” which are captured by the census.
Can a large number of census variables can be reduced to a small number of “factors”?
In the US, repeated studies have shown 3 important factors: socioeconomic status, family status, ethnic status [4].
What aspects of human behavior in cities are not captured by these factors?
*
Limitations of census data
The census is a “gold standard” survey, but it still has limitations:
- Systematically difficult groups (young men, people with irregular addresses, undocumented people)
- Small population subsets even with the large sample of the ACS, it is hard to capture low-frequency population groups
Census authorities spend a huge amount of effort designing their sampling strategy and correcting systematic bias. These issues are general to all data collection, and play an even greater role in large-scale behavioral data.

Geographic references
Familiarize yourself with the hierarchy of US Census statistical geographies
- Geographies listed in the central “trunk” of the plot nest within one another.
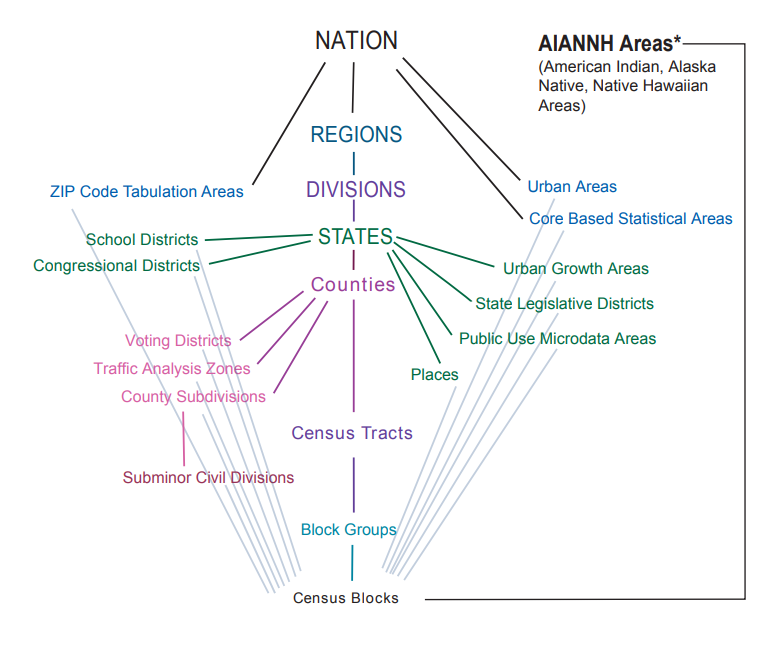
Hierarchy of US Census Statistical Geographies
Geographic identifiers
Every geography used by the census has a unique identifier called a GEOID.
For nesting geographies, you can move up and down in the geographic hierarchy by adding / removing characters from the GEOID
- This is very helpful as it speeds up the process of spatial aggregation, converting a spatial operation to a simple string manipulation
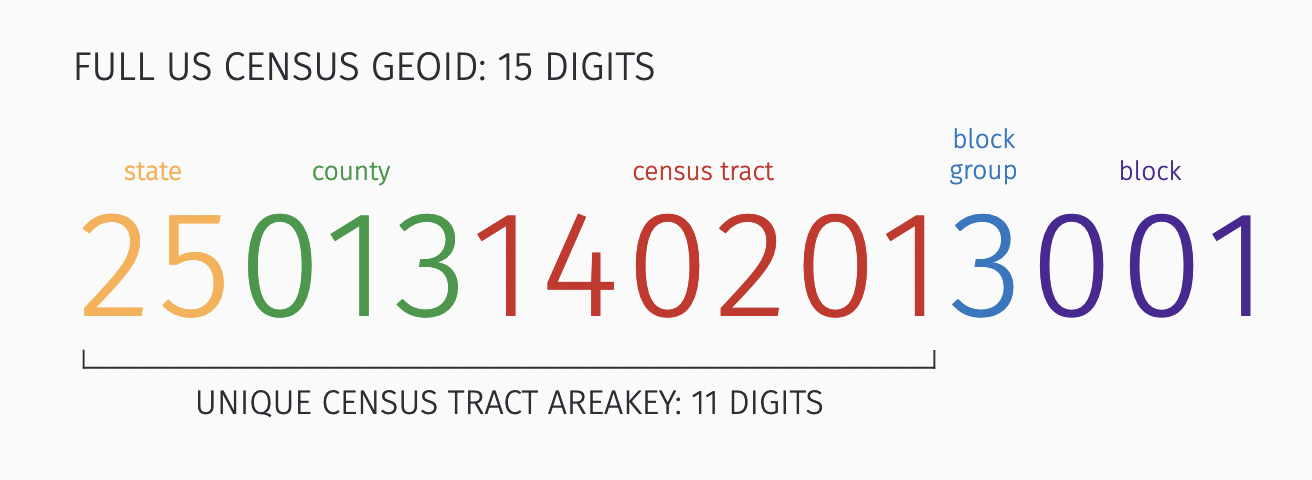
Warning: take note of boundary changes. GEOIDs are re-defined every 10 years, meaning that additional work is required to compare data between decennial censuses.
Combining census data with behavioral data
Many large-scale behavioral datasets are missing demographic information, which can be attributed to individuals based on their residence location. This raises the ecological fallacy: the problem of making assumptions about individuals based on group characteristics
- Which demographic characteristics can be attributed based on residence? Which cannot? Why does this approach work for some characteristics better than others?

References
![]()