Network Science Institute | Northeastern University
NETS 7983 Computational Urban Science
2025-03-31
Welcome!
This week:
Introduction to Urban Data - Mobile Phone Data as a tool for understanding urban systems
Aims
Understand the potential of mobile phone data for urban science.
Learn about the different mobile phone data types and how to extract insights from them.
Discuss the challenges of using mobile phone data for urban science.
Analyze mobile phone data to understand urban dynamics.
Mobile phone data
Why mobile phone data
Mobile phone data is a powerful tool for understanding urban systems. It provides detailed information about the behavior and mobility of individuals, which can be used to study a wide range of urban phenomena, including transportation, land use, social interactions, and economic activity.
Mobile phone data has several advantages over traditional data sources, such as surveys and censuses:
It is more granular, more timely, and less expensive to collect.
It is collected passively, so it is less prone to bias and errors in surveys.
It typically covers a larger sample of the population because a significant fraction of the population owns a mobile phone.
Because of industry standards, it is collected consistently across different regions and countries.
Types of mobile phone data
Three main types of mobile phone data are used in urban science:
Call Detail Records (CDRs): These are records of calls, texts, and data usage made by mobile phone users. They include information about the time, duration, and location of the communication.
Location-based Services (LBS) data: This data comes from apps that use users’ geolocation to provide a service. It includes information about the user’s location, the time of the location, and the type of location.
Bluetooth and Wi-Fi data: This data comes from mobile phones’ Bluetooth and Wi-Fi signals. It includes information about the user’s proximity to other devices and the time of the proximity.
Types of mobile phone data
Those three types of data have very different spatial and temporal scales
Uses of mobile phone data
Mobile phone data is widely used today, especially after COVID-19, by different groups of organizations:
Academia: Researchers use mobile phone data to study urban systems, develop models of human behavior, and test social science theories.
Government: Policymakers use mobile phone data to inform public policy, monitor the impact of interventions, and plan for emergencies. For example, the CDC tracks the spread of diseases, the DOT monitors traffic congestion, and National Statistical Offices use it to complement traditional census data.
Industry: Companies use mobile phone data for marketing, advertising, and product development.
Nonprofits: NGOs use mobile phone data to understand the needs of vulnerable populations, target resources, and evaluate the impact of their programs. For example, the UN and UNICEF constantly use mobile phone data to understand the effects of natural disasters, refugee movements, and the spread of diseases.
Uses of mobile phone data for Urban Science
Mobile phone data is used in urban science to study a wide range of urban phenomena, including:
Transportation: For example, CDR or LBS data can be used to study travel patterns, traffic congestion, and public transportation usage [1][2]
Land use: CDR and LBS can be used to study the distribution of land uses, the density of buildings, and the use of public spaces. [3][4][5]
Social interactions: CDR data like calls or texts to study social networks, the spread of information, and the dynamics of social groups. [3][6][7]
Economic activity: LBS data can be used to study the location of businesses, the flow of goods and services, and the impact of economic policies. [8][9][10]
Public health: LBS data and Bluetooth data can be used to study the spread of diseases, the effectiveness of public health interventions, and the impact of environmental factors on health [11][12], [13][14]
Natural disasters: Mobile phone data like CDR or LBS can be used to study the impact of natural disasters on urban systems, the effectiveness of emergency response, and the resilience of cities, [15], [16][17].
Challenges of mobile phone data
Mobile phone data is a typical example of secondary data. Private companies usually collect data for marketing, billing, network optimization, and other purposes. The data is then sold to third parties, who use it for research, policy, or commercial purposes.
It is important to understand how the data is collected and processed, as this can affect the quality and reliability of the results. Some of the main challenges of using mobile phone data for urban science include:
Drifting: Mobile phone data is subject to changes in how it is collected, processed, and stored. This can lead to inconsistencies and errors in the data, which can affect the validity and reliability of the results.
Privacy: Mobile phone data is highly sensitive and can be used to infer personal information about individuals. This raises concerns about privacy, data security, and the potential for data misuse.
Bias: Mobile phone data is not representative of the general population and is subject to various biases, such as demographic, geographical, temporal, and behavioral biases. This can affect the validity and generalizability of the results.
Data accessibility and Data processing: Mobile phone data is expensive and difficult to access. It is typically stored in large databases and requires specialized analytical tools and techniques. This can create barriers to entry for researchers, policymakers, and the public.
CDR data
Call Detail Records (CDRs)
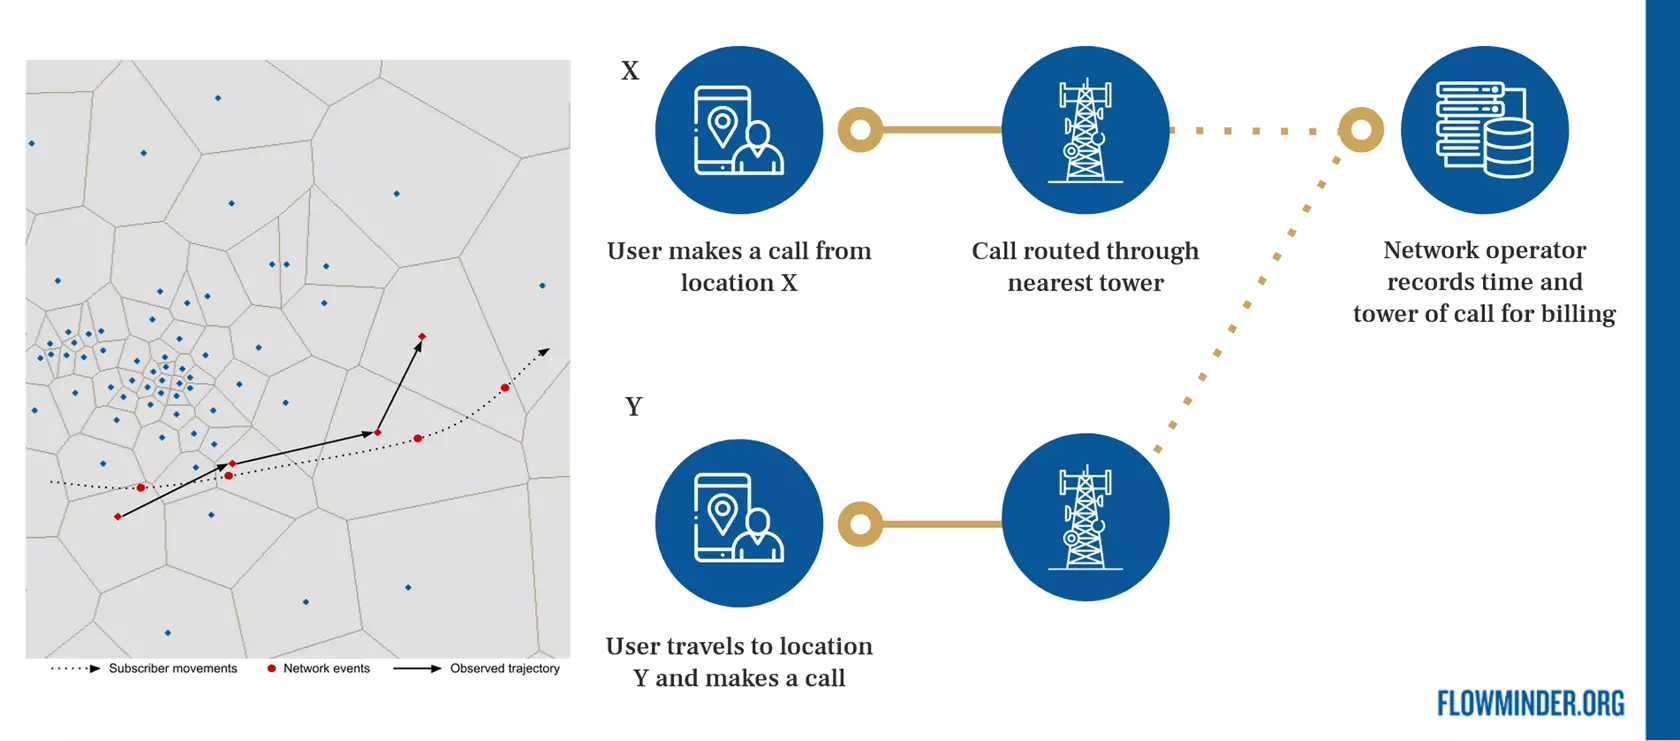
Call Detail Records (CDRs) are records of calls, texts, and data usage made by mobile phone users. They include information about the time, duration, and location of the communication. Here is an example of that data
Note that each raw is a communication event. XDR (Extended Detail Records) also contains data events, such as data usage and app usage.
Call Detail Records (CDRs)
Spatial resolution of CDR: Since the geographical location is at the antenna level, we can use the antenna’s location to infer the user’s location. Since antennas serve a specific area, we can use Voronoi tessellation or other spatial interpolation techniques to do this.
This means that the spatial accuracy of CDR data is typically around 100 meters in urban areas, but it is very large in rural areas. This is one of CDR data’s main limitations in studying small urban spaces.
Call Detail Records (CDRs)
CDR temporal resolution: CDR data typically have a temporal resolution of minutes or hours. This means that we can track individuals’ movements over time and study their behavior in detail.
Population coverage of CDR: CDR data typically covers a large fraction of the population since a large fraction owns a mobile phone. CDR data does not require a data connection, only typically 3G or 4G. Around 97% of the global population (and 90% in the least developed countries) have mobile network coverage. Only 55% of devices in least developed countries are data-enabled mobile devices. This means that we can study the behavior of a large number of individuals and make inferences about the general population.
Mobile coverage rate worldwide, from Statista
Call Detail Records (CDRs)
There are 3 types of information we can get from CDR data:
Social interaction: CDR data contains highly detailed information about when and where people communicate with each other. This information can be used to study social networks, the spread of information, and the dynamics of social groups.
Mobility: CDR data contains information about the user’s location at the time of the communication. This information can be used to reconstruct the mobility patterns of individuals and areas.
Data usage: XDR data contains information about the user’s data usage, including the type of application and the location where the data is consumed. This information can be used to study the digital behavior of users.
This wealth of information made CDRs a powerful tool for understanding social and urban systems.
Uses of CDR data for social interactions
For example, using CDR data to reconstruct the social network of people, Onnela and collaborators [3] studied the Granovetter hypothesis that weak ties are more important for the spread of information than strong ties at a societal level.
Marta Gonzalez, Cesar Hidalgo, and Laszlo Barabasi, and collaborators used CDR data to study the mobility patterns of individuals in urban areas [18]. They also found that people tend to move in predictable patterns, with a few locations accounting for most of their time and activity [19]
Dataset generation for the Netmob 2023 Data Challenge, from [22]
Patterns of app usage by census area using CDR data at antenna level, from [21]
Challenges of CDR data
CDR data is prone to most of the problems of secondary data; see Lecture 1-2.
Incomplete: Most CDR data used in analyses come from a single mobile phone operator, which means that they may not represent the general population. Thus, we are missing social connections with a large fraction of the population.
Drifting: Users often change their mobile phone operators (churns). In developed countries churn rate is around 3% monthly
Bias: Although penetration of phones and smartphones is high in developed countries, mobile phone users are not representative of the general population in other geographies. For example, in developing countries, mobile phone users tend to be younger, wealthier, and more urban than the general population.
Read more about CDR data
Here are some reviews to understand the value of CDR data:
Blondel et al. [23] provide a comprehensive review of the use of CDR data in social science research.
Saramaki and Moro [6] review the use of CDR data in social network analysis.
Handbook of use of mobile phone data for official statistics [24]
LBS data
Location-based Services (LBS) data
Location-based Services data come from apps that use users’ geolocation to provide a service. For example, maps, place recommendations, weather, ride-sharing, and shopping apps collect users’ locations.
Apps collect those locations at different times. When used, they typically collect them in the foreground, but they also collect them in the background to minimize the response time.
Some apps sell location data to third parties. Aggregator companies like Cuebiq, Safegraph, Placer.ai, and others collect locations from different apps and curate and aggregate them to obtain detailed user trajectories in urban areas.
The Location Data Industry: Collectors, Buyers, Sellers, and Aggregators, from The Markup
What information can we get from LBS data?
This raw trajectory data is processed and combined with census data and Points-of-Interest (POI) datasets to produce secondary datasets:
Footfall/Visits to areas or POIs (e.g., daily visits to a Museum by POI of origin).
Flows between areas or to particular POIs (e.g., Origin/Destination matrices between CBGs).
Trips (e.g., the number of trips by car between different areas).
Contacts between people (e.g., number of face-to-face contacts between people within a county).
Raw LBS data
Here is what the raw data looks like. Each raw corresponds to a different location (ping) at a specific time for a particular device (id). Sometimes, companies have meta-data about the device, such as the device type, the app that generated the data, or the demographics of users of that device.
Raw LBS data
LBS data comes from smartphones’ A-GPS technology. This technology uses the GPS signal to locate the device and cell towers to triangulate its position. Because of this, the accuracy of the location is not perfect and can vary from a few meters to 100 meters. LBS data typically reports a circle (center as lat,long, and radius as accuracy) where the user is most likely to be.
Because it uses cell towers and satellite signals, the location data can be affected by shadowing of buildings (urban canyon problem) or indoor localization problems.
We can reconstruct an individual mobility from the raw data by ordering them in time. Note that each point has an accuracy (radius) around it.
Processing LBS data
Raw data is typically processed to extract user activity and mobility information. Many techniques, including clustering, trajectory segmentation, and activity recognition, have been proposed for processing LBS data.
This research is typically known as trajectory data mining, and there is extensive literature about it; see [25] for a review.
Processing LBS data
The first step in processing this data is to clean it. This involves removing duplicate locations, filtering out locations with low accuracy, and removing outliers.
Processing LBS data
The following step in processing those trajectories is to extract information about visits and trips. This can be done by clustering the locations in space and time. Many methods exist based on ideas similar to DBSCAN (or HDBSCAN). Some of them are the Hariharan and Tomaya [26] or the InfoStop [27].
Processing LBS data
At the same time, we can detect the trips between those visits. Using map-matching, public transportation schedules, and information about the trips, we can detect the mode of transportation.
Processing LBS data
We can also detect users ’ home and work locations using the most common visits at night and during working hours. Using information about the area where people live, we can also assign some demographic traits to the device users (only at the census area level). That demographic assignment can also be used to correct population and demographic biases.
Processing LBS data
Finally, we can use an external dataset of Points-of-Interest (POIs) or urban polygons to understand the type of places users visit. This process is called visit attribution, and it depends on the quality of the POI dataset, the accuracy of the visit detection algorithm, the density of POIs, etc. See more information about it, its limitations, and challenges in [28] and in this SafeGraph white paper.
Uses of LBS data
Apart from the obvious uses of LBS data for location-based services, there are many other applications in urban science, primarily related to understanding human mobility and behavior. Some of the most common applications include:
Footfall/Visits to areas or POIs (e.g., daily visits to a Museum by POI of origin).
Flows between areas or to particular POIs (e.g., Origin/Destination matrices between CBGs).
Trips (e.g., the number of trips by car between different areas).
Contacts between people (e.g., number of face-to-face contacts between people within a county).
This, together with the possibility of breaking down this data by demographics, time of the day, day of the week, etc., makes LBS data a powerful tool for understanding urban systems.
Examples of LBS data for urban science
Use of LBS data to understand the diversity of people visiting places or urban spaces. E.g., the “Atlas of Inequality” investigates the (income) diversity of the people visiting different places.
LBS Data is prone to most of the problems of secondary data, see Lecture 1-2
Dirty: For example:
The location of the mobile phone may not be accurate if the GPS signal is weak or if the user is indoors.
Drifting:
Location services might disconnect if the battery is running low, and thus, we might get less data at the end of the day.
Also, since it relies on data from apps, users might uninstall the app or change the settings, causing us to lose data.
Changes in how the operating system or apps collect location data might also affect the data. For example, since iOS 14, Apple requires apps to ask permission to track the user’s location in the background.
Challenges of LBS data
Bias:
Demographic/population: app users might not represent the general population.
Geographical: data might be collected more frequently in urban areas than rural areas.
Temporal: data might be collected more frequently during the day than at night.
Behavioral: data might be collected more frequently when the user is active than when the user is inactive. Also, LBS might be more prevalent in apps related to some behaviors –traveling, shopping, dining out– and thus, users of those apps might be more active than the general population.
Different types of biases in LBS data
Challenges of LBS data
Bias: There are many techniques to alleviate some of those biases. Some of these methods are:
Pre-stratification or panel definition: since the sample of users in LBS data is not random, we can use external data to correct those biases to select a more representative sample of users. Typically, we would like those users to be equally distributed across geographical areas, demographics, and behaviors. This is only possible if we have access to individual trajectories.
Post-stratification or weighting: if we cannot correct the biases in the sample, we can use the external data to weight the data to make it more representative. This is possible even for aggregate data. For example, if we know a particular outcome variable \(m_d\) by demographic strata \(d\) and we know \(w_d\), the penetration rate of our LBS data by strata \(d\), we can use the ratio of the outcome in the sample to the outcome in the population to weigh the data:
\[
\hat m = \sum_d w_d m_d
\]
Challenges of LBS data
Bias: One way to correct for potential biases is to use external ground truth data to validate and reweight our data. For example:
Use ground-truth data about visits to places like museums, supermarkets, and events. Some companies report those numbers. For example, in [29], they compared the post-stratified number of visits to professional sports stadiums with official attendance at those games.
Comparison of the official average attendance to major professional sports games (NFL, NHL, and NBA) with estimations from LBS data
Challenges of LBS data
Bias: One way to correct for potential biases is to use external ground truth data to validate and reweight our data. For example:
In [30], voting roll data validated the number of visits to polling places, allowing for a more detailed comparison of demographic groups.
Or student seasonality behavior for specific brands in US College Towns or worker count for Manufacturing Facilities in the US, done by Unacast.
The same technique applies to flows or trips. Using the Department of Transportation (DoT) data, [1] compared the results from LBS data to the number of trips in the DoT data.
Challenges of LBS data
Privacy:
LBS data is highly sensitive. It can be used to infer personal information about individuals, such as home and work locations, daily routines, and social interactions.
This information can be used to track individuals, target them with ads, or discriminate against them. There are many techniques to protect the privacy of LBS data, such as differential privacy or k-anonymity. For example:
Safegraph or Placer.ai data only provides aggregated data at the census block group level and only if more than four devices are included.
Although Cuebiq data is collected at the individual level, it is privacy-enhanced, so mobility around personal places (home, work) is obfuscated at the CBG level.
Advan (formerly Safegraph) started applying differential privacy techniques in January 2023 by adding noise to users’ home locations.
Challenges of LBS data
Data access: LBS data is expensive and difficult to access. It is often sold by aggregators to third parties, who may not have the expertise to analyze it. This creates unequal access for researchers, policymakers, and the public.
Data processing: LBS data is complex and requires specialized analytical tools and techniques. It is often stored in large databases and requires significant computational resources. There are some libraries to process that kind of data:
Mobility is an R package for modeling human mobility patterns.
Read more about LBS data in Urban Science
Carlo Ratti about the use of LBS to understand urban dynamics [31]
Use of mobile phone location data to understand COVID-19 [11]
Future trends in the study of mobility using LBS data [32]
The Department of Transportation (DoT) on the use of LBS data for Transit Planning and Operations [2]
References
[1]
Y. Xu, R. D. Clemente, and M. C. González, “Understanding vehicular routing behavior with location-based service data,”EPJ Data Science, vol. 10, no. 1, pp. 1–17, Dec. 2021, doi: 10.1140/epjds/s13688-021-00267-w.
[2]
J. Shaw, L. Flint, E. Englin, et al., “Location-based service data for transit agency planning and operations: Market scan and feasibility analysis,” United States. Department of Transportation. Federal Transit Administration, 2023.
[3]
J.-P. Onnela et al., “Structure and tie strengths in mobile communication networks,”Proceedings of the National Academy of Sciences, vol. 104, no. 18, pp. 7332–7336, May 2007, doi: 10.1073/pnas.0610245104.
[4]
V. Soto and E. Frı́as-Martı́nez, “Automated land use identification using cell-phone records,” in Proceedings of the 3rd ACM international workshop on MobiArch, 2011, pp. 17–22.
[5]
M. De Nadai, J. Staiano, R. Larcher, N. Sebe, D. Quercia, and B. Lepri, “The death and life of great italian cities: A mobile phone data perspective,” in Proceedings of the 25th international conference on world wide web, 2016, pp. 413–423.
[6]
J. Saramäki and E. Moro, “From seconds to months: An overview of multi-scale dynamics of mobile telephone calls,”The European Physical Journal B, vol. 88, no. 6, p. 164, Jun. 2015, doi: 10.1140/epjb/e2015-60106-6.
[7]
G. Miritello, E. Moro, and R. Lara, “Dynamical strength of social ties in information spreading,”Physical Review E, vol. 83, no. 4, p. 045102, Apr. 2011, doi: 10.1103/PhysRevE.83.045102.
[8]
N. Eagle, M. Macy, and R. Claxton, “Network Diversity and EconomicDevelopment,”Science, vol. 328, no. 5981, pp. 1029–1031, May 2010, doi: 10.1126/science.1186605.
[9]
J. L. Toole, Y.-R. Lin, E. Muehlegger, D. Shoag, M. C. González, and D. Lazer, “Tracking employment shocks using mobile phone data,”Journal of The Royal Society Interface, vol. 12, no. 107, p. 20150185, Jun. 2015, doi: 10.1098/rsif.2015.0185.
[10]
S. Wang, Y. Zheng, G. Wang, T. Yabe, E. Moro, and A. ‘Sandy’. Pentland, “Infrequent activities predict economic outcomes in major American cities,”Nature Cities, pp. 1–10, Mar. 2024, doi: 10.1038/s44284-024-00051-7.
[11]
K. H. Grantz et al., “The use of mobile phone data to inform analysis of COVID-19 pandemic epidemiology,”Nature Communications, vol. 11, no. 1, p. 4961, Sep. 2020, doi: 10.1038/s41467-020-18190-5.
[12]
A. Aleta et al., “Modelling the impact of testing, contact tracing and household quarantine on second waves of COVID-19,”Nature Human Behaviour, vol. 4, no. 9, pp. 964–971, Sep. 2020, doi: 10.1038/s41562-020-0931-9.
[13]
A. L. Horn et al., “Population mobility data provides meaningful indicators of fast food intake and diet-related diseases in diverse populations,”npj Digital Medicine, vol. 6, no. 1, pp. 1–12, Nov. 2023, doi: 10.1038/s41746-023-00949-x.
[14]
B. García Bulle Bueno et al., “Effect of mobile food environments on fast food visits,”Nature Communications, vol. 15, no. 1, p. 2291, Mar. 2024, doi: 10.1038/s41467-024-46425-2.
[15]
T. Yabe, K. Tsubouchi, N. Fujiwara, Y. Sekimoto, and S. V. Ukkusuri, “Understanding post-disaster population recovery patterns,”Journal of The Royal Society Interface, vol. 17, no. 163, p. 20190532, Feb. 2020, doi: 10.1098/rsif.2019.0532.
[16]
C. Xia, Y. Hu, G. Chi, and J. Chen, “Assessing dynamics of human vulnerability at community level – Using mobility data,”International Journal of Disaster Risk Reduction, vol. 96, p. 103964, Oct. 2023, doi: 10.1016/j.ijdrr.2023.103964.
[17]
T. Yabe, N. K. Jones, P. S. C. Rao, M. C. Gonzalez, and S. V. Ukkusuri, “Mobile phone location data for disasters: A review from natural hazards and epidemics,”Computers, Environment and Urban Systems, vol. 94, p. 101777, 2022.
[18]
M. C. González, C. A. Hidalgo, and A.-L. Barabási, “Understanding individual human mobility patterns,”Nature, vol. 453, no. 7196, pp. 779–782, Jun. 2008, doi: 10.1038/nature06958.
[19]
C. Song, Z. Qu, N. Blumm, and A.-L. Barabási, “Limits of Predictability in HumanMobility,”Science, vol. 327, no. 5968, pp. 1018–1021, Feb. 2010, doi: 10.1126/science.1177170.
[20]
P. Deville et al., “Dynamic population mapping using mobile phone data,”Proceedings of the National Academy of Sciences, vol. 111, no. 45, pp. 15888–15893, Nov. 2014, doi: 10.1073/pnas.1408439111.
[21]
I. Ucar, M. Gramaglia, M. Fiore, Z. Smoreda, and E. Moro, “News or social media? Socio-economic divide of mobile service consumption,”Journal of The Royal Society Interface, vol. 18, no. 185, p. 20210350, Dec. 2021, doi: 10.1098/rsif.2021.0350.
[22]
O. E. Martínez-Durive, S. Mishra, C. Ziemlicki, S. Rubrichi, Z. Smoreda, and M. Fiore, “The NetMob23Dataset: AHigh-resolution Multi-region Service-level MobileDataTrafficCartography.” arXiv, Jul. 2023. doi: 10.48550/arXiv.2305.06933.
[23]
V. D. Blondel, A. Decuyper, and G. Krings, “A survey of results on mobile phone datasets analysis,”EPJ Data Science, vol. 4, no. 1, p. 10, Dec. 2015, doi: 10.1140/epjds/s13688-015-0046-0.
[24]
U. ESCAP, “Handbook on the use of mobile phone data for official statistics,” 2019.
[25]
Y. Zheng, “Trajectory DataMining: AnOverview,”ACM Trans. Intell. Syst. Technol., vol. 6, no. 3, pp. 29:1–29:41, May 2015, doi: 10.1145/2743025.
[26]
R. Hariharan and K. Toyama, “Project Lachesis: Parsing and ModelingLocationHistories,” in Geographic InformationScience, M. J. Egenhofer, C. Freksa, and H. J. Miller, Eds., Berlin, Heidelberg: Springer, 2004, pp. 106–124. doi: 10.1007/978-3-540-30231-5_8.
[27]
U. Aslak and L. Alessandretti, “Infostop: Scalable stop-location detection in multi-user mobility data,”arXiv preprint arXiv:2003.14370, 2020.
[28]
T. Yabe, B. G. B. Bueno, X. Dong, A. Pentland, and E. Moro, “Behavioral changes during the COVID-19 pandemic decreased income diversity of urban encounters,”Nature Communications, vol. 14, no. 1, p. 2310, Apr. 2023, doi: 10.1038/s41467-023-37913-y.
[29]
E. Moro, D. Calacci, X. Dong, and A. Pentland, “Mobility patterns are associated with experienced income segregation in large US cities,”Nature Communications, vol. 12, no. 1, pp. 1–10, Jul. 2021, doi: 10.1038/s41467-021-24899-8.
[30]
A. Coston, N. Guha, D. Ouyang, L. Lu, A. Chouldechova, and D. E. Ho, “Leveraging AdministrativeData for BiasAudits: AssessingDisparateCoverage with MobilityData for COVID-19 Policy,” in Proceedings of the 2021 ACMConference on Fairness, Accountability, and Transparency, in FAccT ’21. New York, NY, USA: Association for Computing Machinery, Mar. 2021, pp. 173–184. doi: 10.1145/3442188.3445881.
[31]
C. Ratti, D. Frenchman, R. M. Pulselli, and S. Williams, “Mobile Landscapes: UsingLocationData from CellPhones for UrbanAnalysis,”Environment and Planning B: Planning and Design, vol. 33, no. 5, pp. 727–748, Oct. 2006, doi: 10.1068/b32047.
[32]
L. Pappalardo, E. Manley, V. Sekara, and L. Alessandretti, “Future directions in human mobility science,”Nature Computational Science, vol. 3, no. 7, pp. 588–600, Jul. 2023, doi: 10.1038/s43588-023-00469-4.