5 + 3 # Basic arithmetic in R[1] 8In this course, we are going to use mainly R, RStudio, and Quarto to create and share documents.
Note that the objective of this course is not to teach you how to use these tools but to use them to learn about computational urban science. Follow the materials below to help you get up to speed with them.
R is a programming language and software environment specifically designed for statistical computing and data visualization. It is widely used in data science, statistics, and academia for its rich ecosystem of packages and powerful data analysis capabilities.
Here’s a simple example of using R for basic arithmetic:
5 + 3 # Basic arithmetic in R[1] 8ggplot2 for data visualization, dplyr for data manipulation, and tidyr for data tidying.Tidyverse It is a great starting point for beginners as it provides a consistent and coherent data manipulation and visualization approach. It is based on tidy data and piping principles, making it easy to read and write code.
# Load the Tidyverse package
library(tidyverse)
mtcars |>
  filter(cyl == 6) |>
  select(mpg, hp, wt)
mpg hp wt
Mazda RX4 21.0 110 2.620
Mazda RX4 Wag 21.0 110 2.875
Hornet 4 Drive 21.4 110 3.215
Valiant 18.1 105 3.460
Merc 280 19.2 123 3.440
Merc 280C 17.8 123 3.440
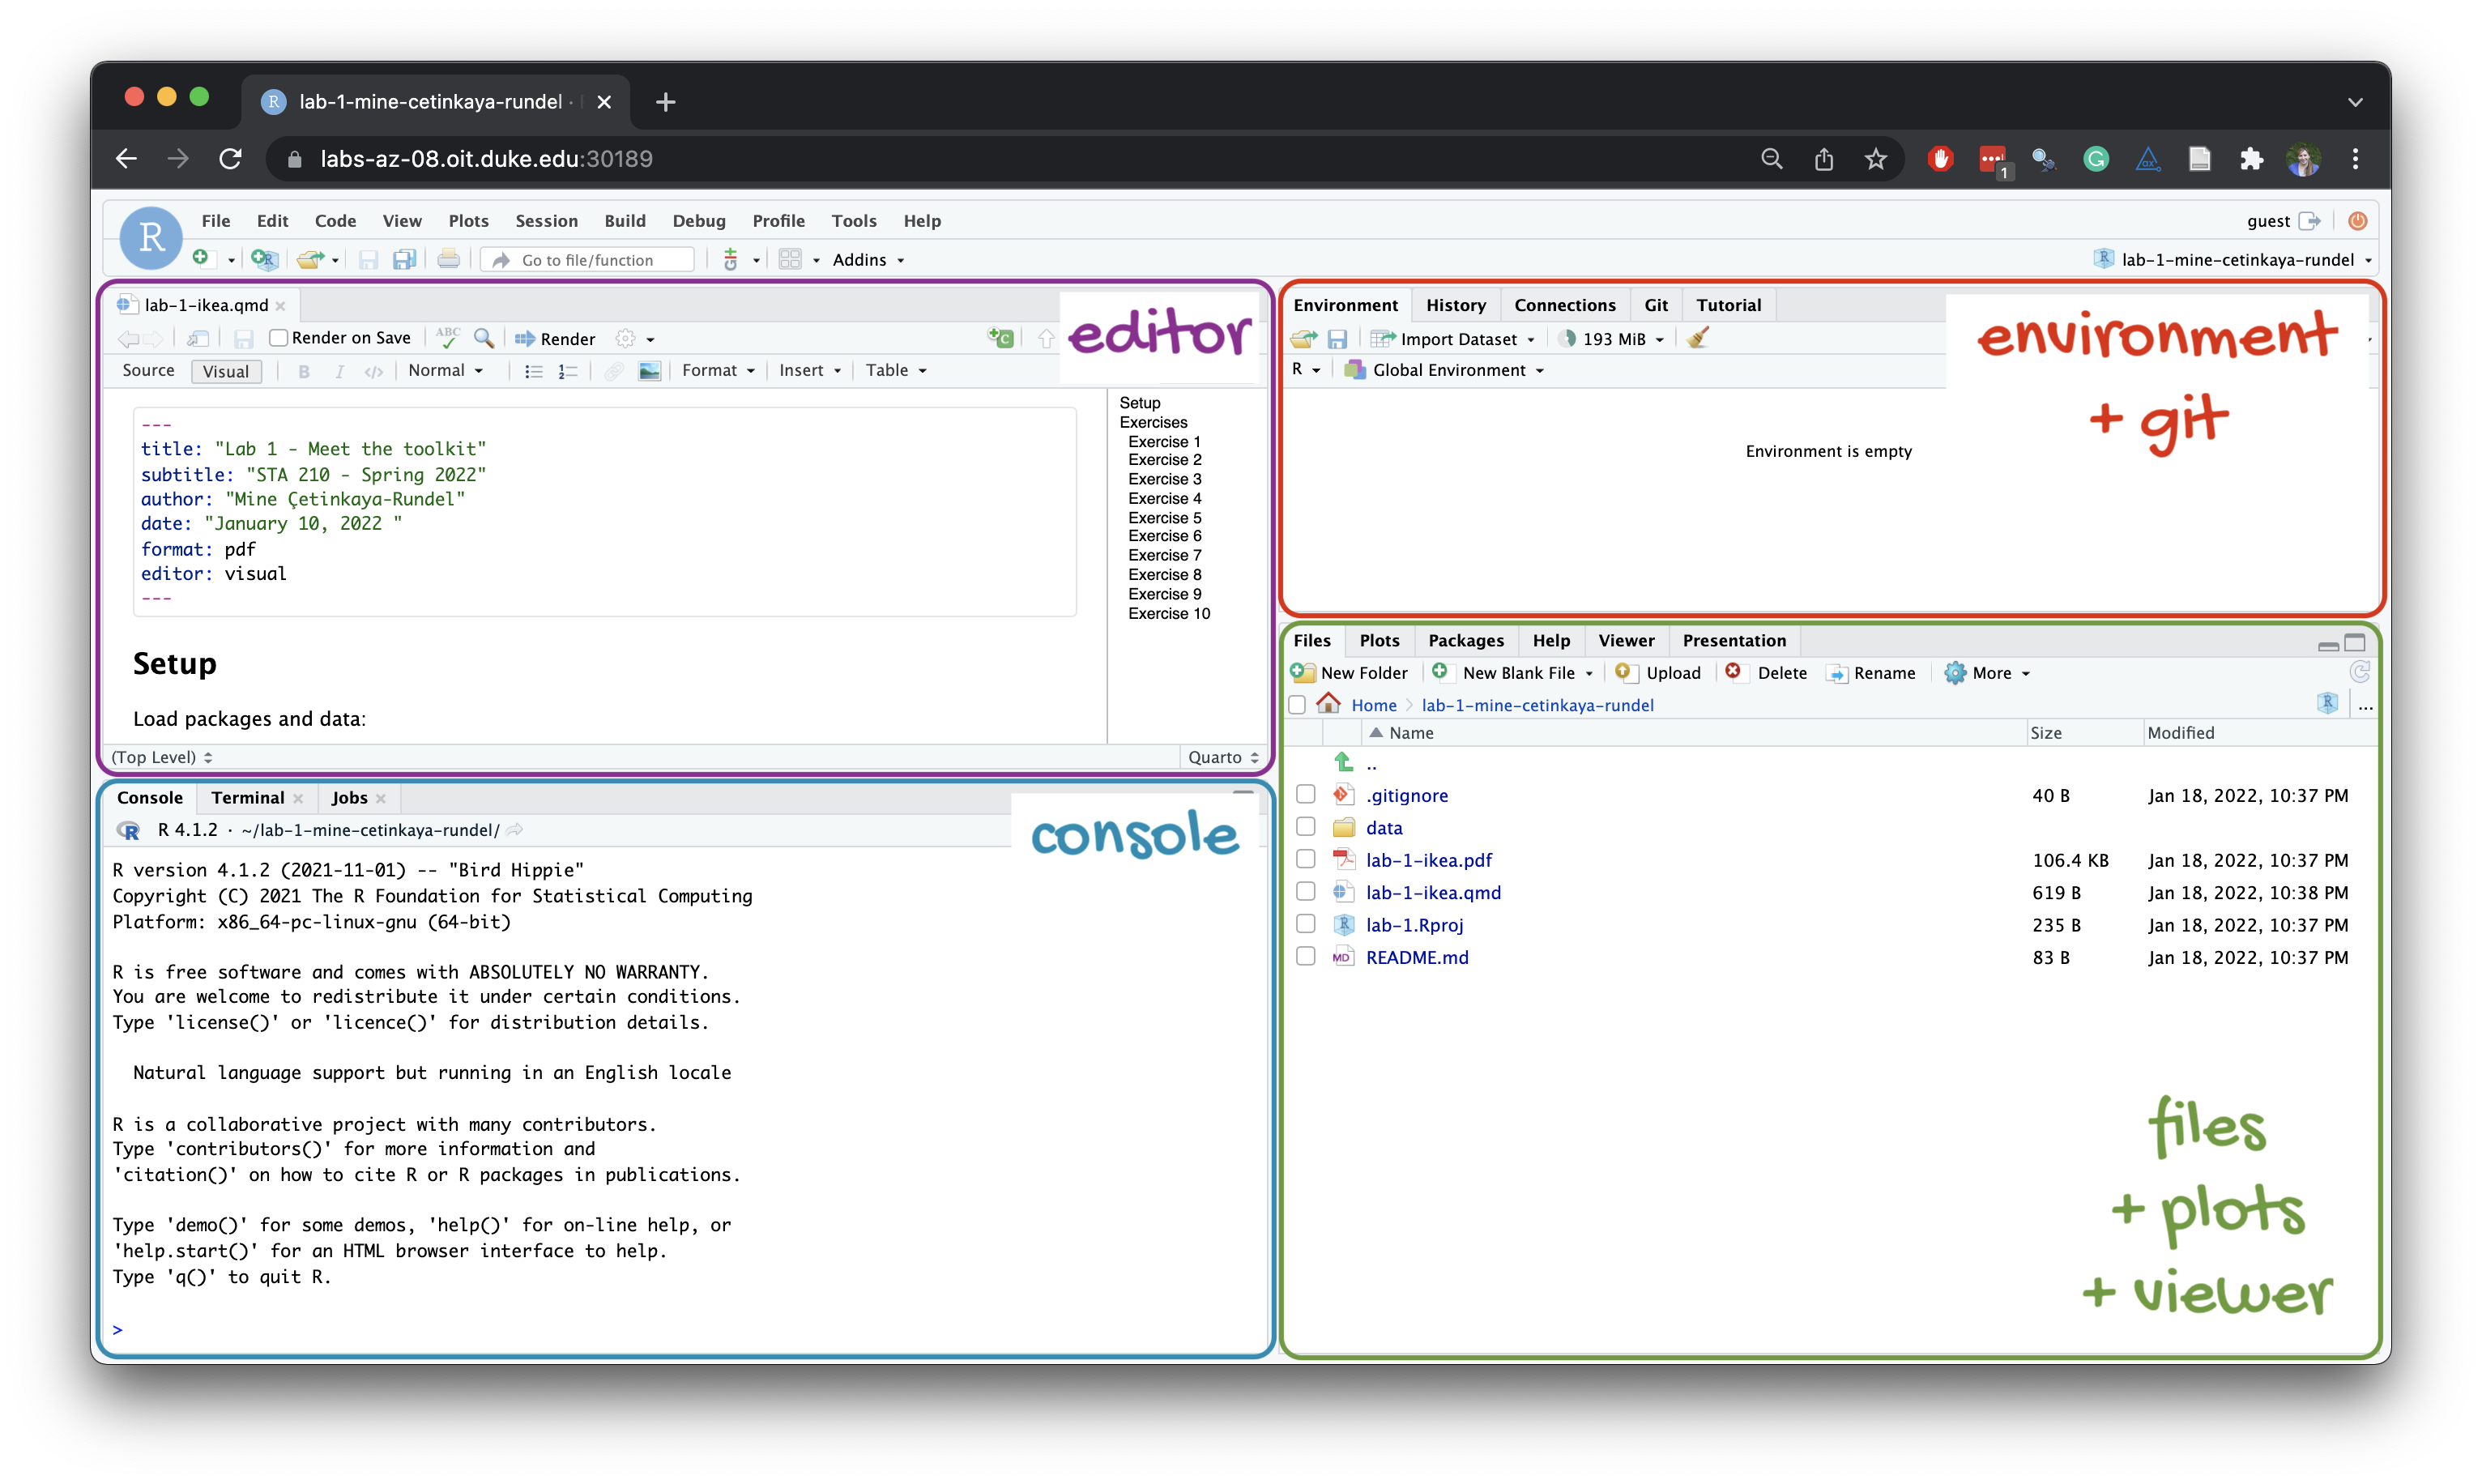
Ferrari Dino 19.7 175 2.770RStudio is an integrated development environment (IDE) for R that provides a user-friendly interface for writing, running, and debugging R code. It includes features like syntax highlighting, code completion, and integrated plotting tools to enhance the R programming experience.
Quarto is a document format that combines the power of R, Python, and Markdown to create interactive and reproducible documents. It allows you to embed code, visualizations, and interactive elements directly into your documents, making it easy to share and collaborate on data analysis projects.
All material in this course is made with R, RStudio, and Quarto, including the website, the lecture slides, and the labs.
Here’s how you can use Quarto to create a report:
.qmd file.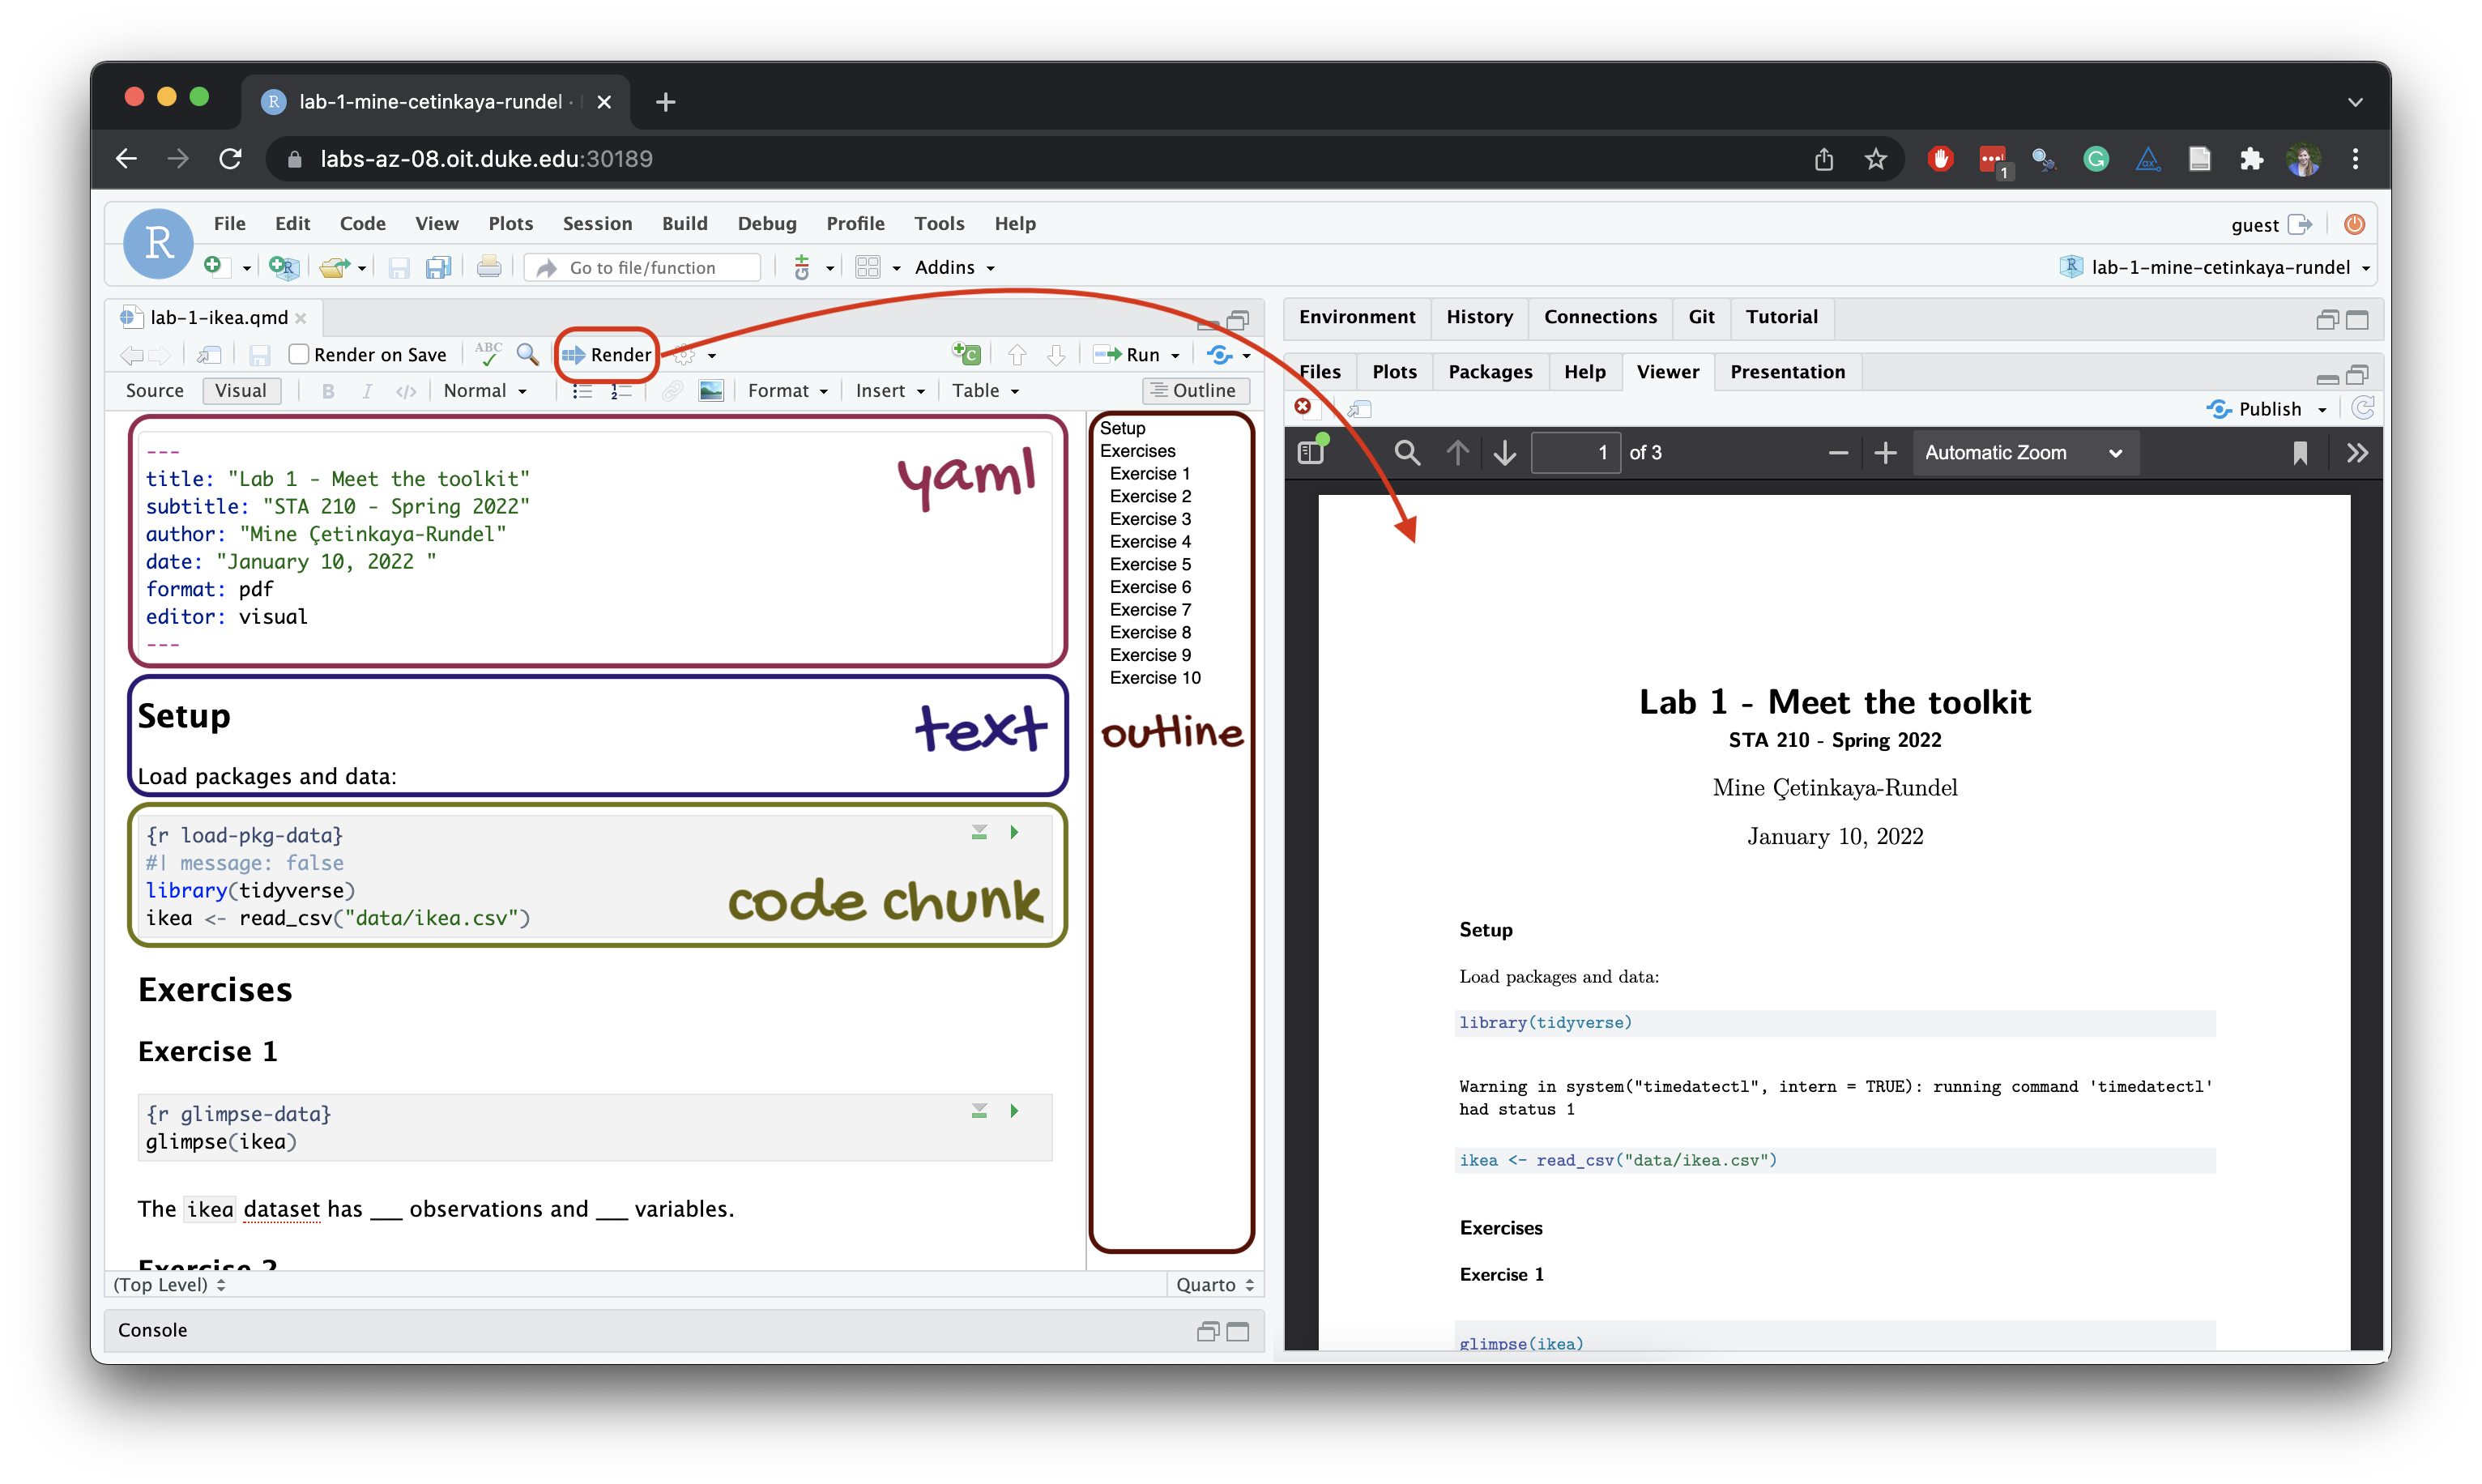
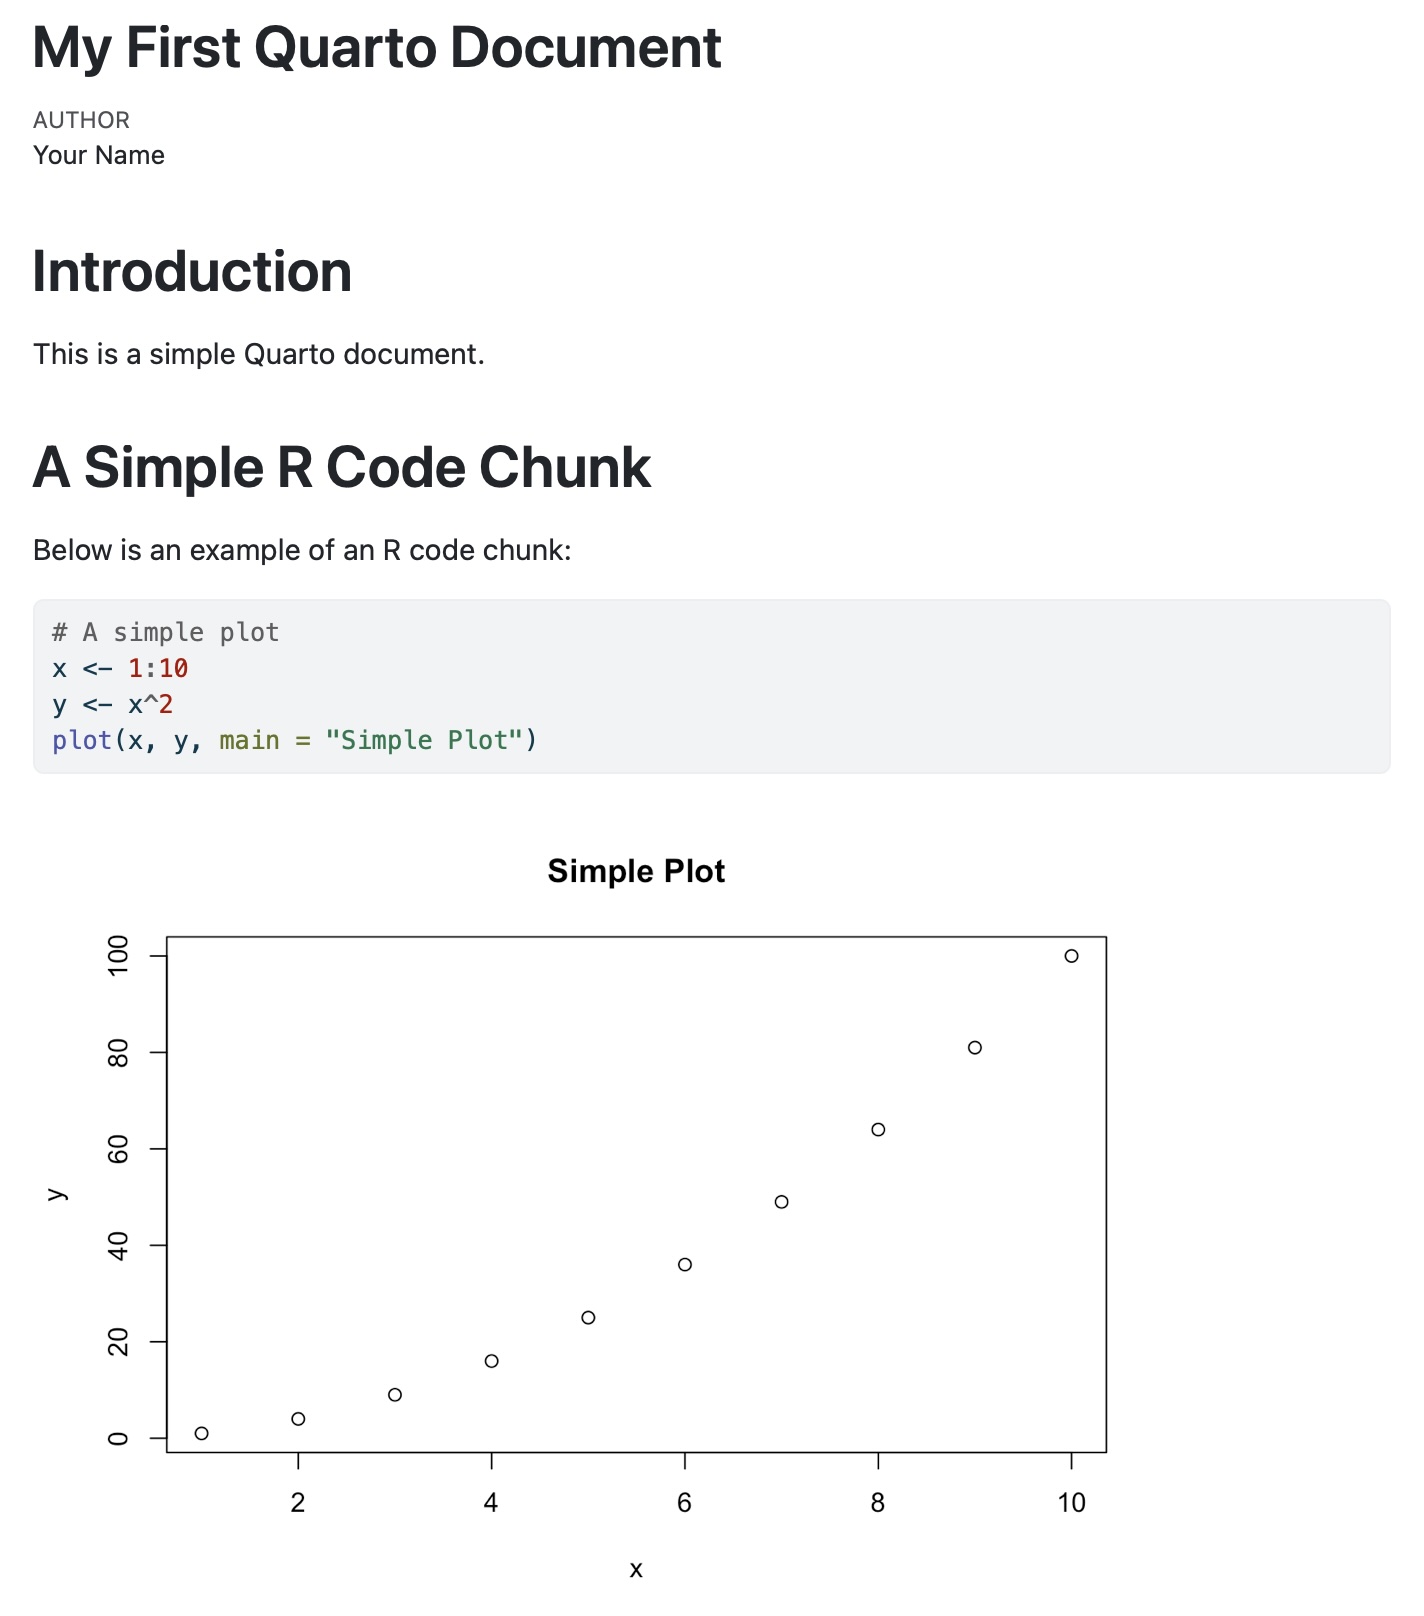
Here is a minimal Quarto document example
---
title: "My First Quarto Document"
author: "Your Name"
format: html
---

# Introduction
This is a simple Quarto document.

# A Simple R Code Chunk
Below is an example of an R code chunk:
```{r}
# A simple plot
x <- 1:10
y <- x^2
plot(x, y, main = "Simple Plot")
```
which will be rendered like